PercoVIS is a tool for visualizing percolation on networks.
The formation of networks can be studied as a link percolation process. Link percolation is also sometimes called bond percolation, or percolation on a network. A common formulation of percolation on a network considers a collection of intially isolated nodes. Over time, links are introduced which connect the nodes. The links can be added randomly or according to various schemes. Many interesting research questions are focused on the ways in which a well-connected network emerges over time. PercoVIS tries to make the network percolation process more intuitive by providing a nice way to view percolation as it happens. Version 1.2 of PercoVIS also assists in understanding the Social Climber attachment model that Dane Taylor and I described in 2012 [PDF]. Social Climber attachment investigates forming networks that self-organize to promote efficient spreading processes or dynamics on the nodes of the network. The rest of this page is devoted to PercoVIS and its use, but you can read more about my research and download my other papers on my home page.
Download and Source
Download a compiled executable for MacOS, or find the source code here on github, at http://github.com/dblarremore/percovis.
 PercoVIS for Mac OS |
||
 PercoVIS by Daniel B. Larremore is licensed under a Creative Commons Attribution-NonCommercial-ShareAlike 3.0 Unported License. |
||
PercoVIS is free to download for non-commercial purposes, under the Creative Commons license linked above. The current version is 1.2 and has been tested on Mac OSX 10.8 (Mountain Lion). I may someday release Windows and Linux versions, but OSX makes it so much easier to bundle and deploy apps and I have not yet put in the effort. If someone is familiar with Qt for Linux or Windows and would like to help deploy PercoVIS for other operating systems, please . I would like to acknowledge my colleagues Dane Taylor for his ideas and help in creating PercoVIS, and Sebastian Skardal and Juan Restrepo for their feedback. I would also like to acknowledge the NSF's Mentoring Through Critical Transition Points (MCTP) Grant, No DMS-0602284 and the University of Colorado at Boulder's Department of Applied Mathematics.
How to use PercoVIS
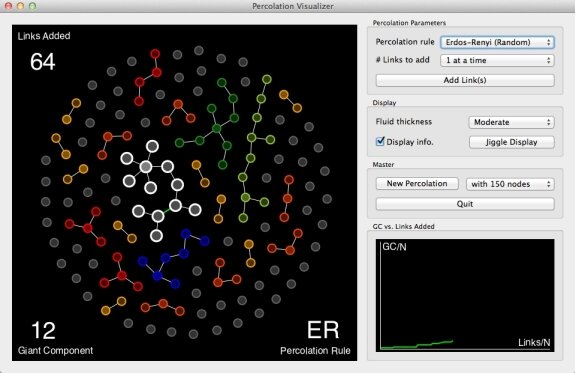
Here is a sample screenshot of PercoVIS in action. Size has been reduced by 40%. Click the image to enlarge. The window is divided into 3 parts, discussed in detail below:1. The nodes (left)
2. The plot (bottom right)
3. The controls (upper right)
Left Panel - The Nodes

To be as intuitive as possible, nodes are depicted as circles and links as lines. Node colors correspond to the size of clusters. For example, disconnected nodes are grey, while nodes that are members of clusters of size four are red. Within each cluster, the node with the largest degree (number of links) is shaded slightly lighter than the others. The Giant Component (GC) has its nodes slightly enlarged so that it stands out more in the diagram. In the screenshot above, the GC is white, and you can see that its nodes are larger. For better visualization, the most recently added link is bold green, while the other links are thin white. Clusters of size greater than 11 are all colored white.
 When using the Product Rule (PR) to generate a link, two links are initially considered but only one is created. To help understand how the PR works, the proposed but unformed link can also be displayed by using The Controls. Proposed PR links are shown as yellow dashed lines.
 When using Social Climber (SC) attachment to generate a link, the link is sometimes modified prior to formation so that it connects the same clusters but by using different nodes. To help understand how SC attachment works, the unmodified and unformed link can also be displayed by using The Controls. Unformed SC links are shown as red dashed lines.
Information about the total number of links added, the size of the GC, and the rule that will govern the addition of the next links are shown in the corners. This information can be enabled or disabled in the upper right panel - The Controls.
To achieve a nice display, nodes are cast as point charges which repel each other. A circular boundary is also charged to keep the nodes in a circular corral. Nodes are not allowed to leave the screen. Links are cast as linear springs, though unformed PR and SC links are displayed without spring effects. Each node also experiences drag proportional to its velocity. Therefore, nodes want to spread themselves evenly throughout the circle, but nodes of the same cluster stick together. The drag insures that the system stops jiggling around, though you may adjust the strength of the drag or "fluid thickness" in the upper right panel - The Controls.
You may use the mouse to click and drag nodes around the display. This is useful for separating clusters visually, but does not affect the percolation process itself.
Bottom Right Panel - The Plot
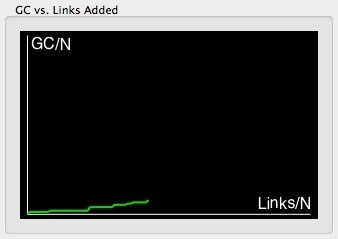
 Since the Giant Component (GC) changes in size as more links are added, many analyses focus on a plot like the one shown in this panel. To avoid rescaling the plot each time the number of nodes changes, the axes are scaled by the number of nodes. This is both a common practice in publication as well as a tip of the hat to a common type of question people ask about network percolation: "What happens when the number of nodes grows extremely large, say one million, one billion, or beyond?" By plotting things relative to the total number of nodes, we can get a grasp on how the GC scales with the number of links added (also relative to the number of nodes). Because of these conventions, the horizontal and vertical axes only plot up to one. You can continue to see the percolation for more links, but the plot stops plotting for Links/N > 1.
Upper Right Panel - The Controls
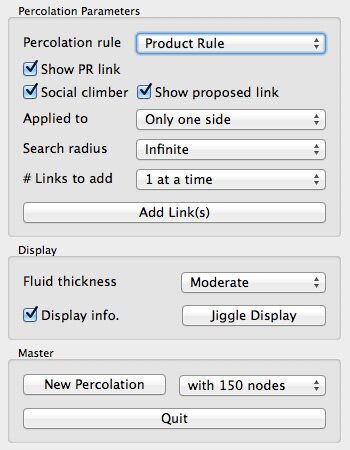
 Percolation Rule allows you to change the rule by which new links are selected and added to the network. The options are "Erdos-Renyi (Random)," "Adjacent Edge," and "Product Rule." Erdos-Renyi chooses links at random. Adjacent Edge chooses two potential links emanating from the same node, creates the link which connects to a smaller cluster, and discards the link which would have connected to a larger cluster. This is one method of achieve the so-called "explosive percolation." Product Rule chooses two potential links between any two pairs of nodes, computes the products of the sizes of each pair of clusters, creates the link corresponding to the smaller product, and discards the other link. This is another method of achieving explosive percolation.
Show PR link toggles the visibility of the discarded link of the Product Rule. This option only appears if the Percolation rule is set to Product Rule.
Social climber toggles whether or not Social Climber attachment [PDF] is used to form links.
Applied to allows you to change from one-sided Social Climber attachment (SC) to two-sided Social Climber attachment (DSC). This option only appears if Social climber is checked.
Search Radius allows you to choose the number of geodesic steps Social Climber attachment uses to search for a better connected neighbor. This option only appears if Social climber is checked. In the paper explaining SC attachment [PDF], we only describe the case of Infinite search radius, but discuss the possibility of finite radius search in speculative concluding remarks.
# Links to add allows you to change the number of links that get added each time you add links.
Add Link(s) adds the number of links selected in the # Links to add drop-down menu.
Fluid thickness changes the magnitude of the drag on the nodes in the left panel. The thinnest setting will let the nodes jiggle and bounce considerably and the thickest setting will give the nodes the feel of being in a thick molasses.
Display info. toggles whether or not the text information is displayed in the left panel.
Jiggle Display perturbs the locations of each node randomly in X and Y directions. This can be useful if all the clusters are "tangled." This works nicely to untangle if the fluid thickness is thinner.
New Percolation will erase all the current data and start from scratch using the number of nodes in the adjacent pull-down menu.
with 150 nodes sets the number of nodes that will be created for a new percolation if the new percolation button is clicked. Currently, the options are 50, 100, 150, 250, and 500 nodes. More than 500 nodes produces a bit of graphic lag on some systems, since the interactions of the nodes need to be calculated for all the nodes. The display also looks very crowded for larger numbers of nodes.
Quit does what you think it does, but...why would you want to?
